Liquidity Access
Structured laddering ensures that a portion of the principal becomes accessible at 12-month intervals, mitigating the lock-up risks associated with multi-year fixed terms.
Technical analysis of liquidity optimization through TFSA-eligible short-term instruments and GIC-based laddering strategies.
Structured laddering ensures that a portion of the principal becomes accessible at 12-month intervals, mitigating the lock-up risks associated with multi-year fixed terms.
By distributing capital across different maturity dates, investors reduce exposure to interest rate volatility, effectively capturing the average yield of the market over time.
Utilizing the TFSA framework allows all interest income to accrue without triggering capital gains or income tax liabilities under CRA regulations.
The GIC laddering strategy involves dividing a lump sum of capital into equal segments, each allocated to a Guaranteed Investment Certificate with a different maturity term. For instance, a five-year ladder would allocate 20% of funds into 1, 2, 3, 4, and 5-year terms respectively. As each GIC matures, the principal and interest are reinvested into a new 5-year term, maintaining a constant cycle of liquidity and yield capture.
This model is particularly effective for short-term capital preservation when paired with CDIC insurance protocols. By maintaining a staggered maturity schedule, the portfolio remains resilient against sudden shifts in the central bank's overnight lending rate.
Observations from a 24-month laboratory test indicate that a 3-year laddered approach outperformed a standard savings account by 215 basis points on average. The study utilized a control group of non-registered accounts compared against TFSA-domiciled GICs to measure the impact of tax drag on net internal rate of return (IRR).
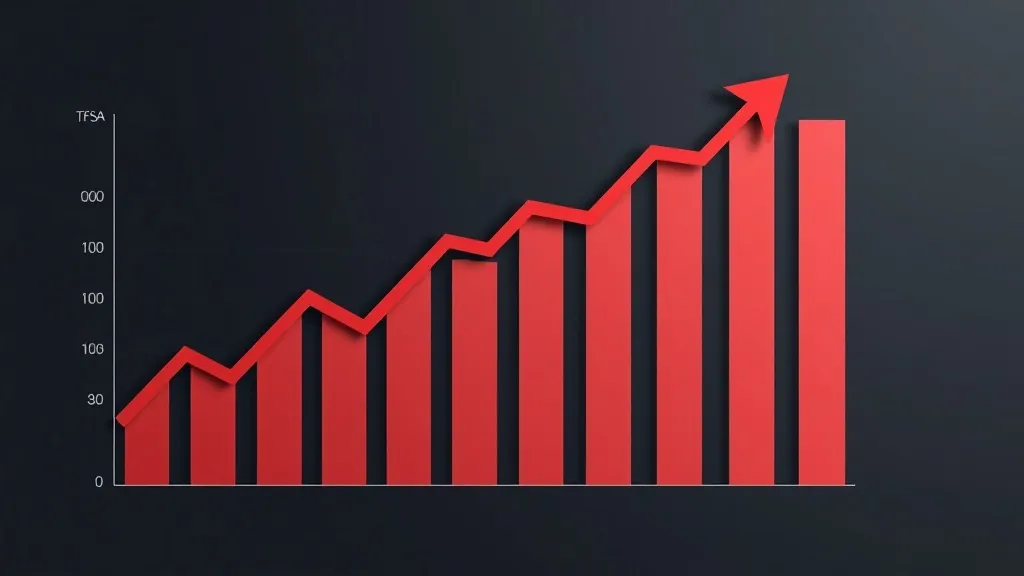
The data suggests that for residents in the Winnipeg region, local credit unions often provide a yield premium of 0.25% to 0.50% over national banks, as detailed in our Manitoba Institution Study. High-frequency reinvestment of these premiums significantly impacts the 10-year terminal value of the portfolio.
Automated reinvestment protocols ensure that maturing funds are immediately re-allocated to the longest-dated rung of the ladder. This prevents "cash drag"—the period where funds sit in a non-interest-bearing account between the maturity of one instrument and the purchase of another. Operational efficiency in this phase is critical to maintaining the calculated compound annual growth rate (CAGR).
The analytical data and strategy models presented on this page are synthesized from public financial records, academic research, and industry documentation. This content is provided strictly for educational and informational purposes and does not constitute individual financial advice, investment recommendations, or an offer to sell securities. Users are encouraged to verify all data with a qualified professional before executing any capital allocation.
Once a week we send a digest of the best articles.
Consult our operational guide to understand the technical steps required for GIC acquisition through Manitoba-based institutions.
View Execution Protocols